A water budget for a catchment describe inflows including rainfall and runoff, outflows through evapotranspiration, the stream network, and change in storage, including in water bodies, soil water and groundwater. In the Gilbert River catchment, a dominant pattern of water budgets is the monsoonal climate with nearly all rain falling in the wet season.
 - AWRA-L.jpg)
A variety of data sources can be used to try to “close” the water balance, so that estimates of all the inflows, outflows and change in storage add up. Weather (especially BOM weather stations) and streamflow monitoring provide field measurements. GIS data describes the stream network. Models align the data and draw on understanding of hydrological processes, e.g. AWRA-L model and eWater Source hydrological model.
Estimating water flows and storage at catchment or property scale remains uncertain - it is difficult to fully close the water balance. All the elements of the water budget vary in space, and no matter how you measure or model the values, there’s always uncertainty. We expect measurements or models using different methods to be different. Whenever we use a water budget, we have to work out whether that uncertainty matters, or whether we need to reduce it, to get a more precise estimate.
Property water budgets
First-pass property water budgets can be obtained using data from the AWRA-L model and stream network data from the Australian Hydrological Geospatial Fabric (Geofabric). A property can be split into a set of Geofabric sub-catchments, and mapped along with streams and overland flow lines, points at which they cross property boundaries, as well as water infrastructure such as bores and dams. The AWRA-L grid can be overlain for context.
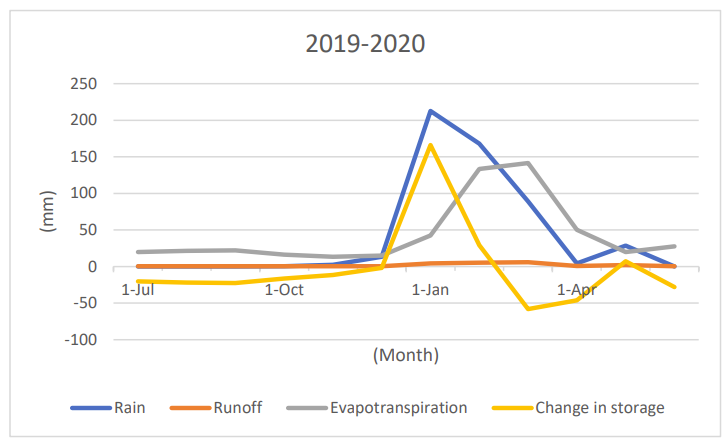
For each sub-catchment, modelled rainfall, runoff, evapotranspiration, and change in storage can be summed on a monthly basis, emphasising months of increasing and decreasing storage, and multiplied by area to provide estimated volumes of water for each sub-catchment within the property boundaries and upstream.
This water balance is not calibrated but provides initial fine-scale estimates. In addition to uncertainty in measurements and models, exact flow boundaries and paths might not be quite right. We have overland flow paths, flood flows, sub-surface soil flows (unsaturated zone), and poor understanding of groundwater at a fine scale. Landholders may have local knowledge that is not captured in the estimated budget made with publicly available data. Regulatory and physical limits on capture of rainfall and local runoff also need to be considered in interpreting the water budget, e.g. landholder water availability from the Gilbert river is limited to water entitlements. In 2022, conversations with landholders indicated that estimates of runoff seemed too low, possibly because AWRA-L is underestimating rainfall-runoff ratios in high intensity rainfall. The names of streams also did not always match landholders’ nomenclature.
Resources
On this website: