There are seven telemetered flow gauges throughout the Gilbert River catchment. Data is available at the Queensland Government’s Water Monitoring Information Portal.
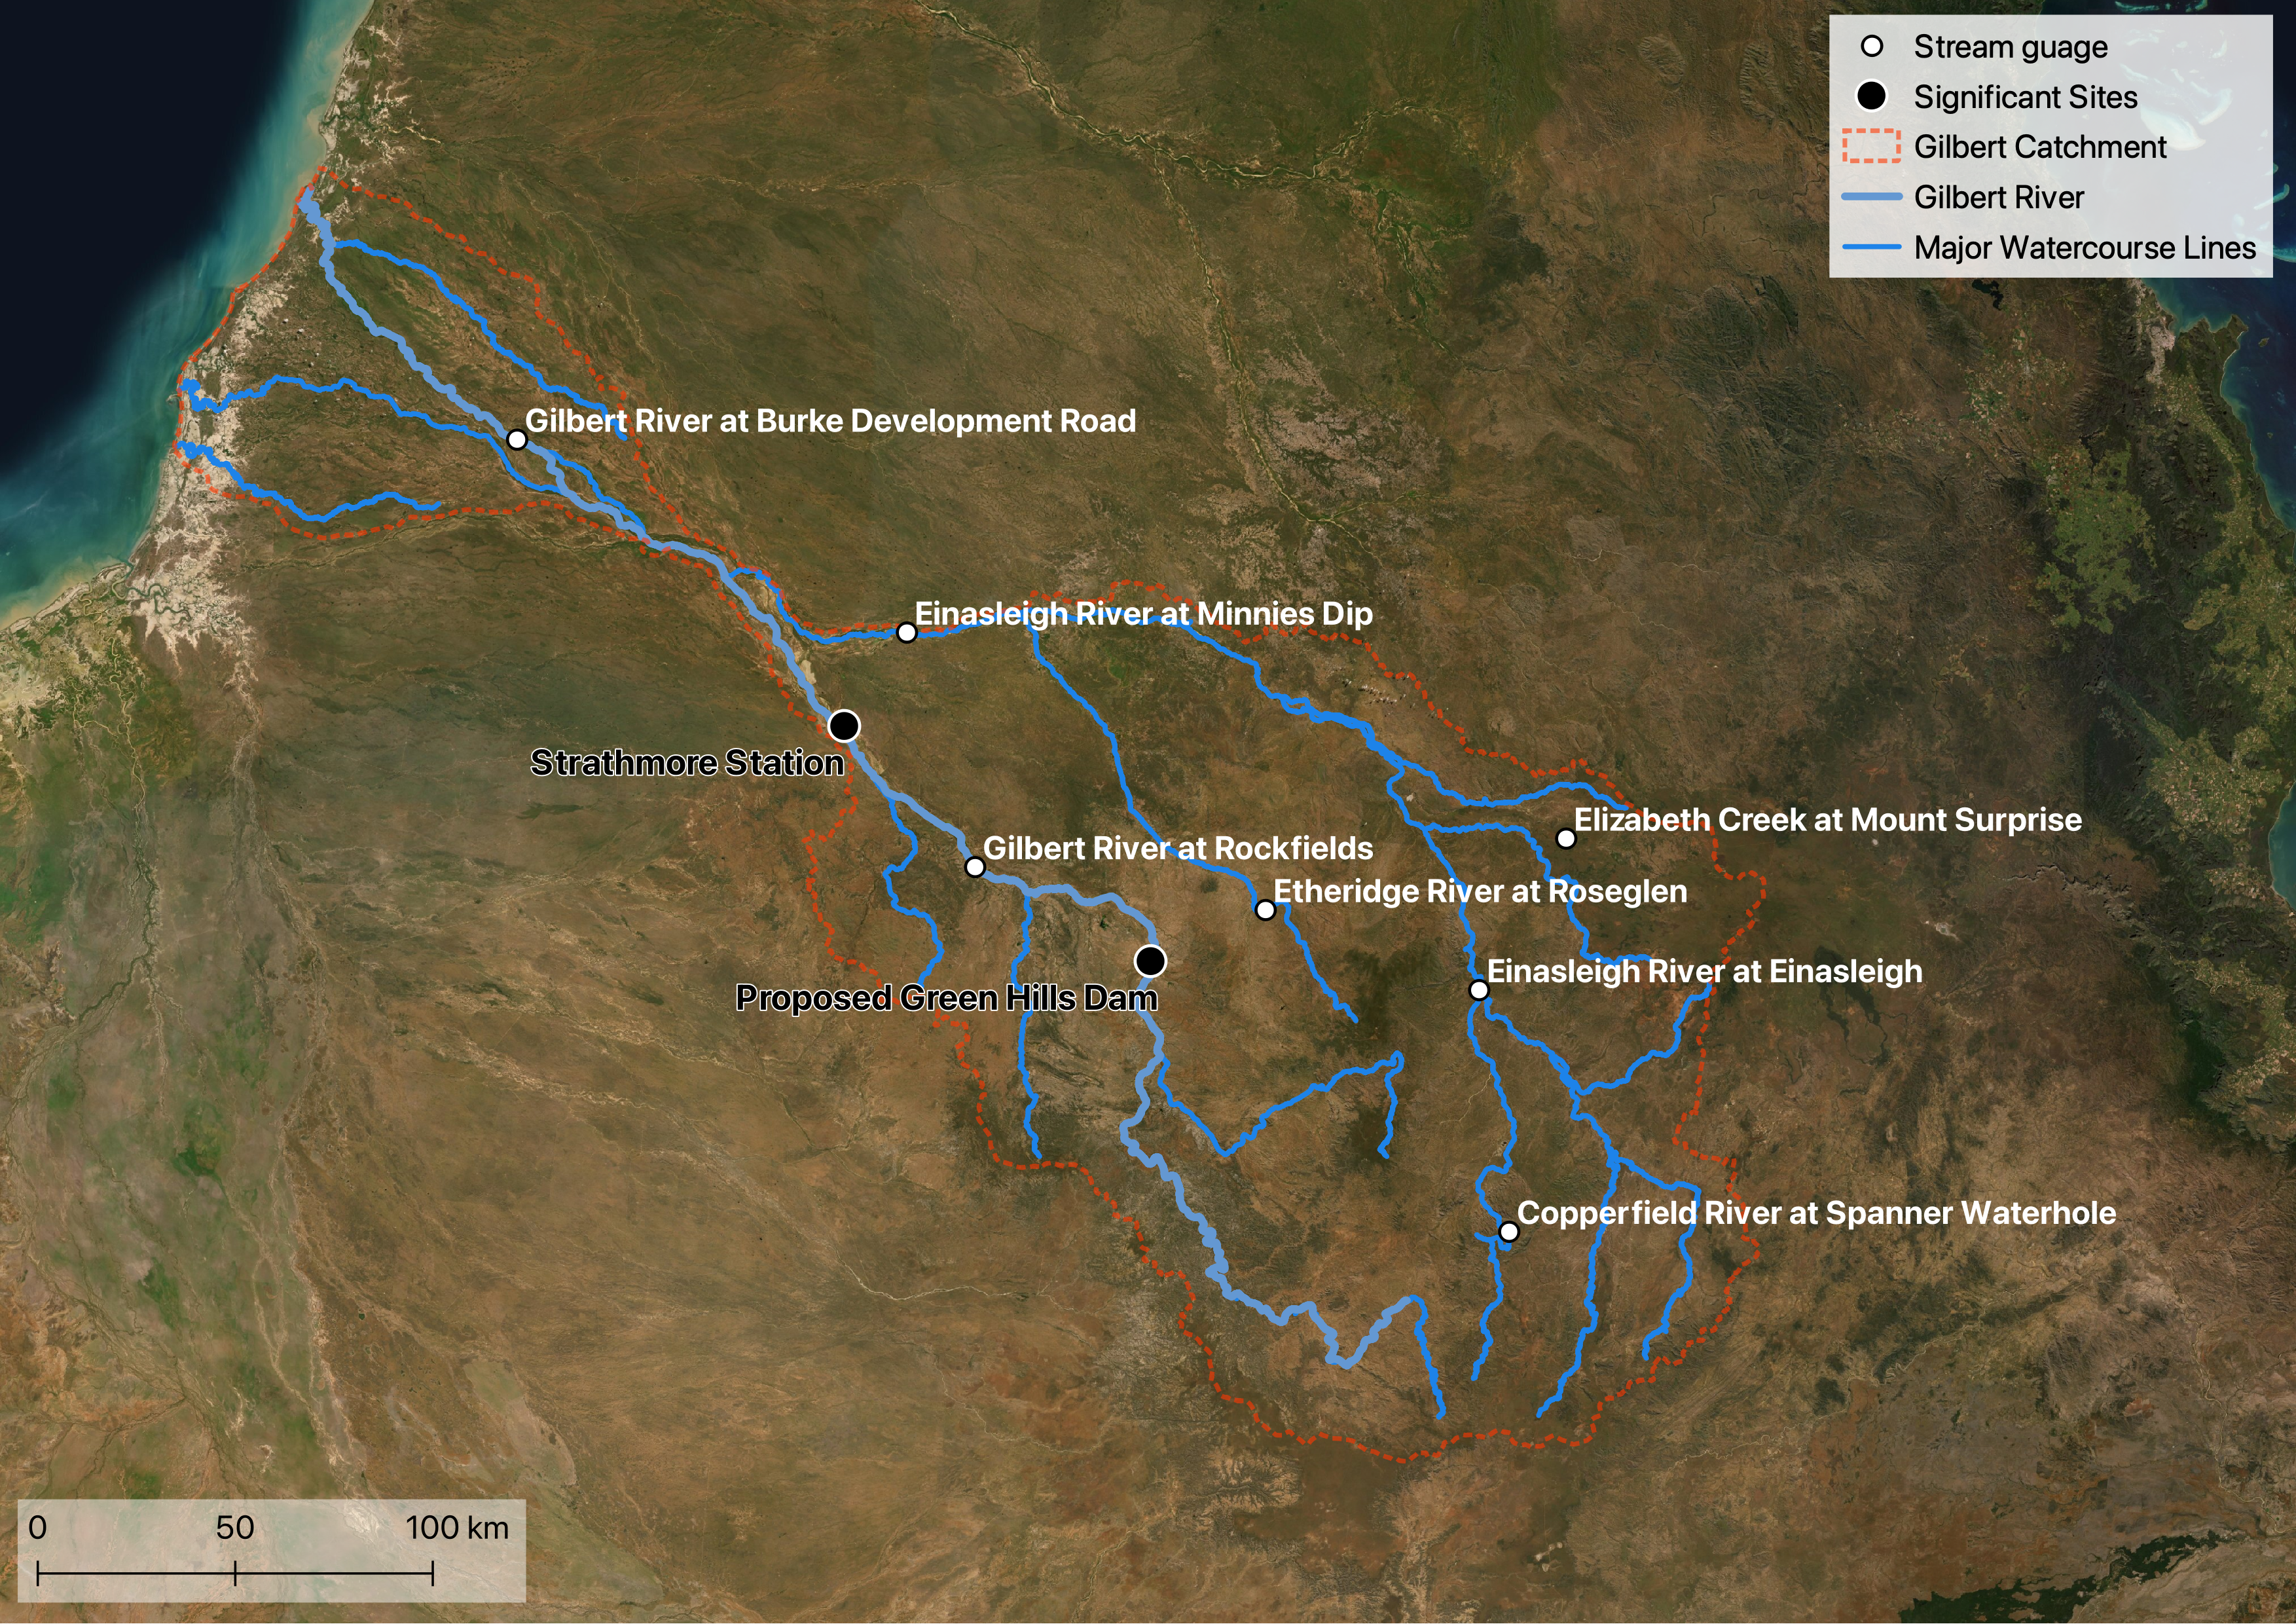
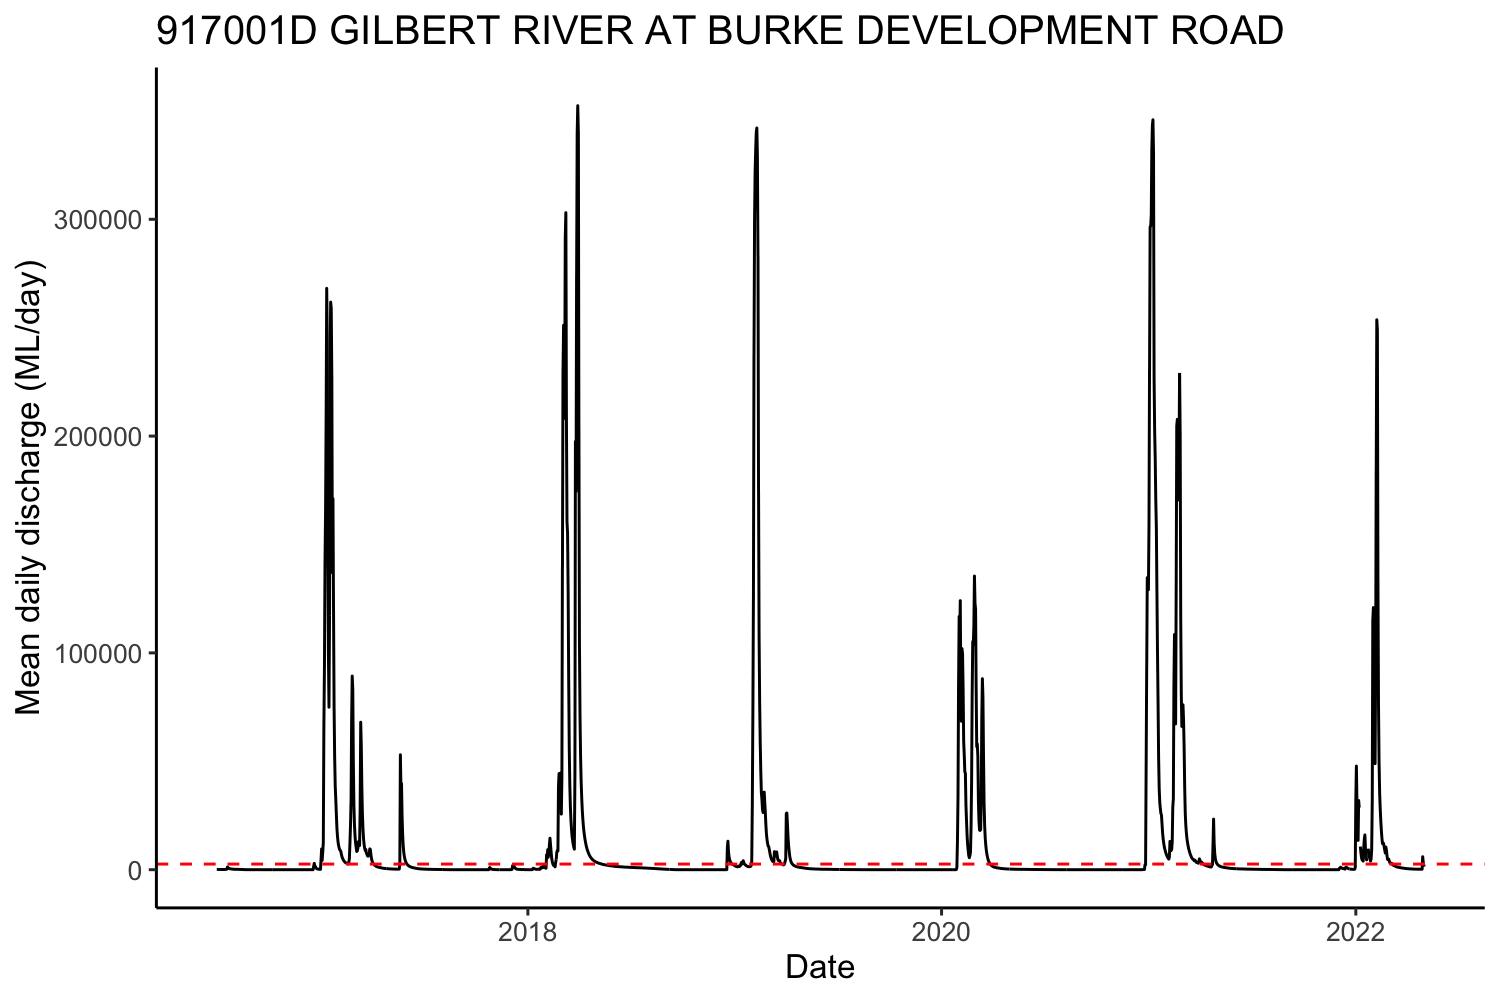
The two stream gauges most relevant to the GRAP are Gilbert River at Rockfields (gauge: 917001D), which is in the in the middle of the GRAP, and Gilbert River at Burke Development Road (gauge: 917014A), which is downstream of where the Gilbert River and Einasleigh River converge. As is common in a monsoonal system, during the wet season streamflow peaks and there are periods of no flow in the dry season.
These two gauges are also used when setting flow conditions for the current Gulf unallocated water release. The flow threshold at Gilbert River at Rockfields gauge must exceed 2,592 ML per day to take water in the GRAP and the flow threshold at Gilbert River at Burke Development Road gauge must exceed 15,100 ML per day to take water downstream of the GRAP.
Between July 1st 2016 and June 30th 2021 (water years: 2016, 2017, 2018, 2019 and 2020), only 11% of days exceeded the flow threshold at the Gilbert River at Rockfields gauge.
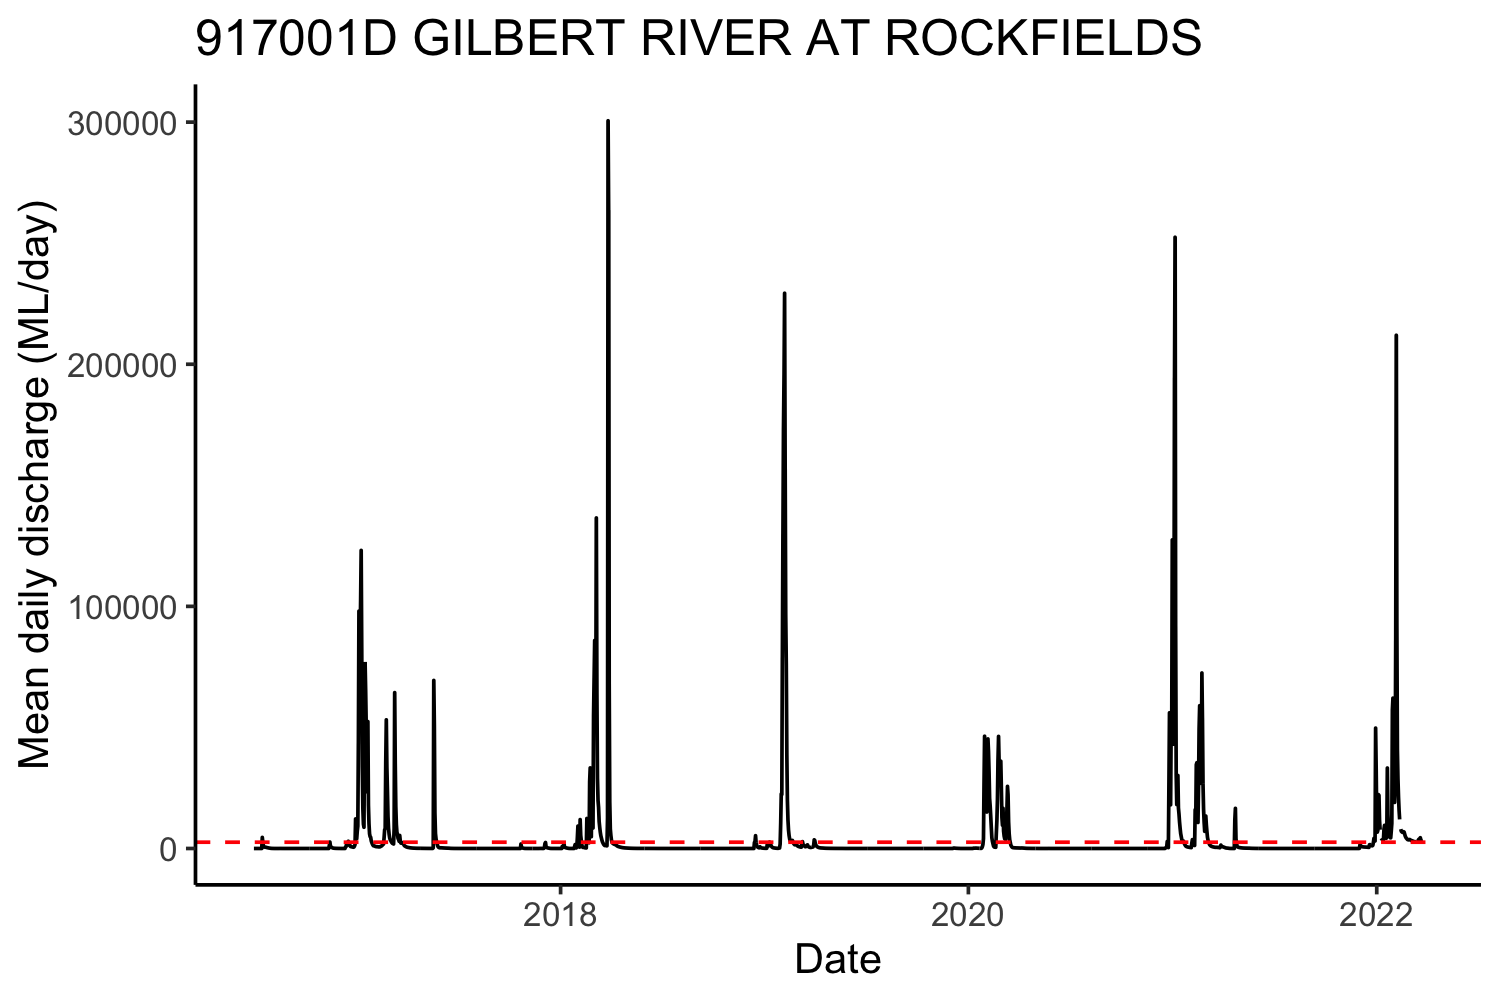
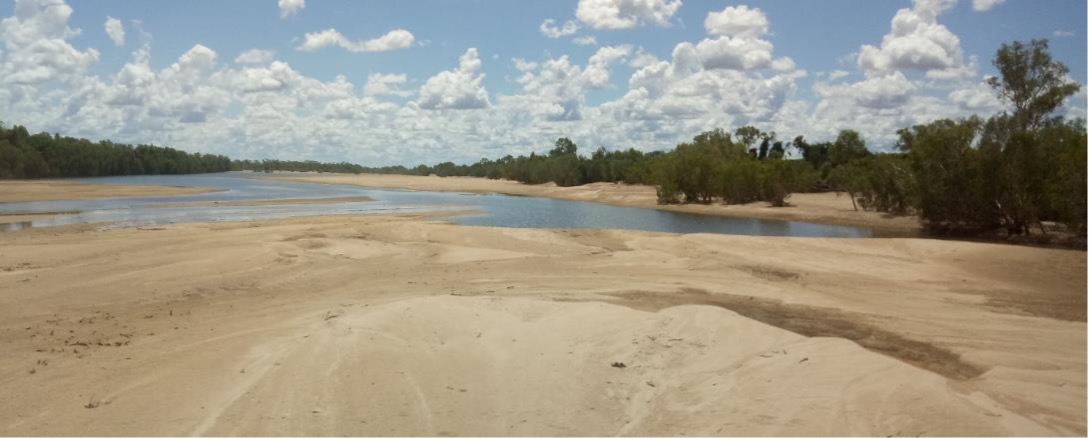
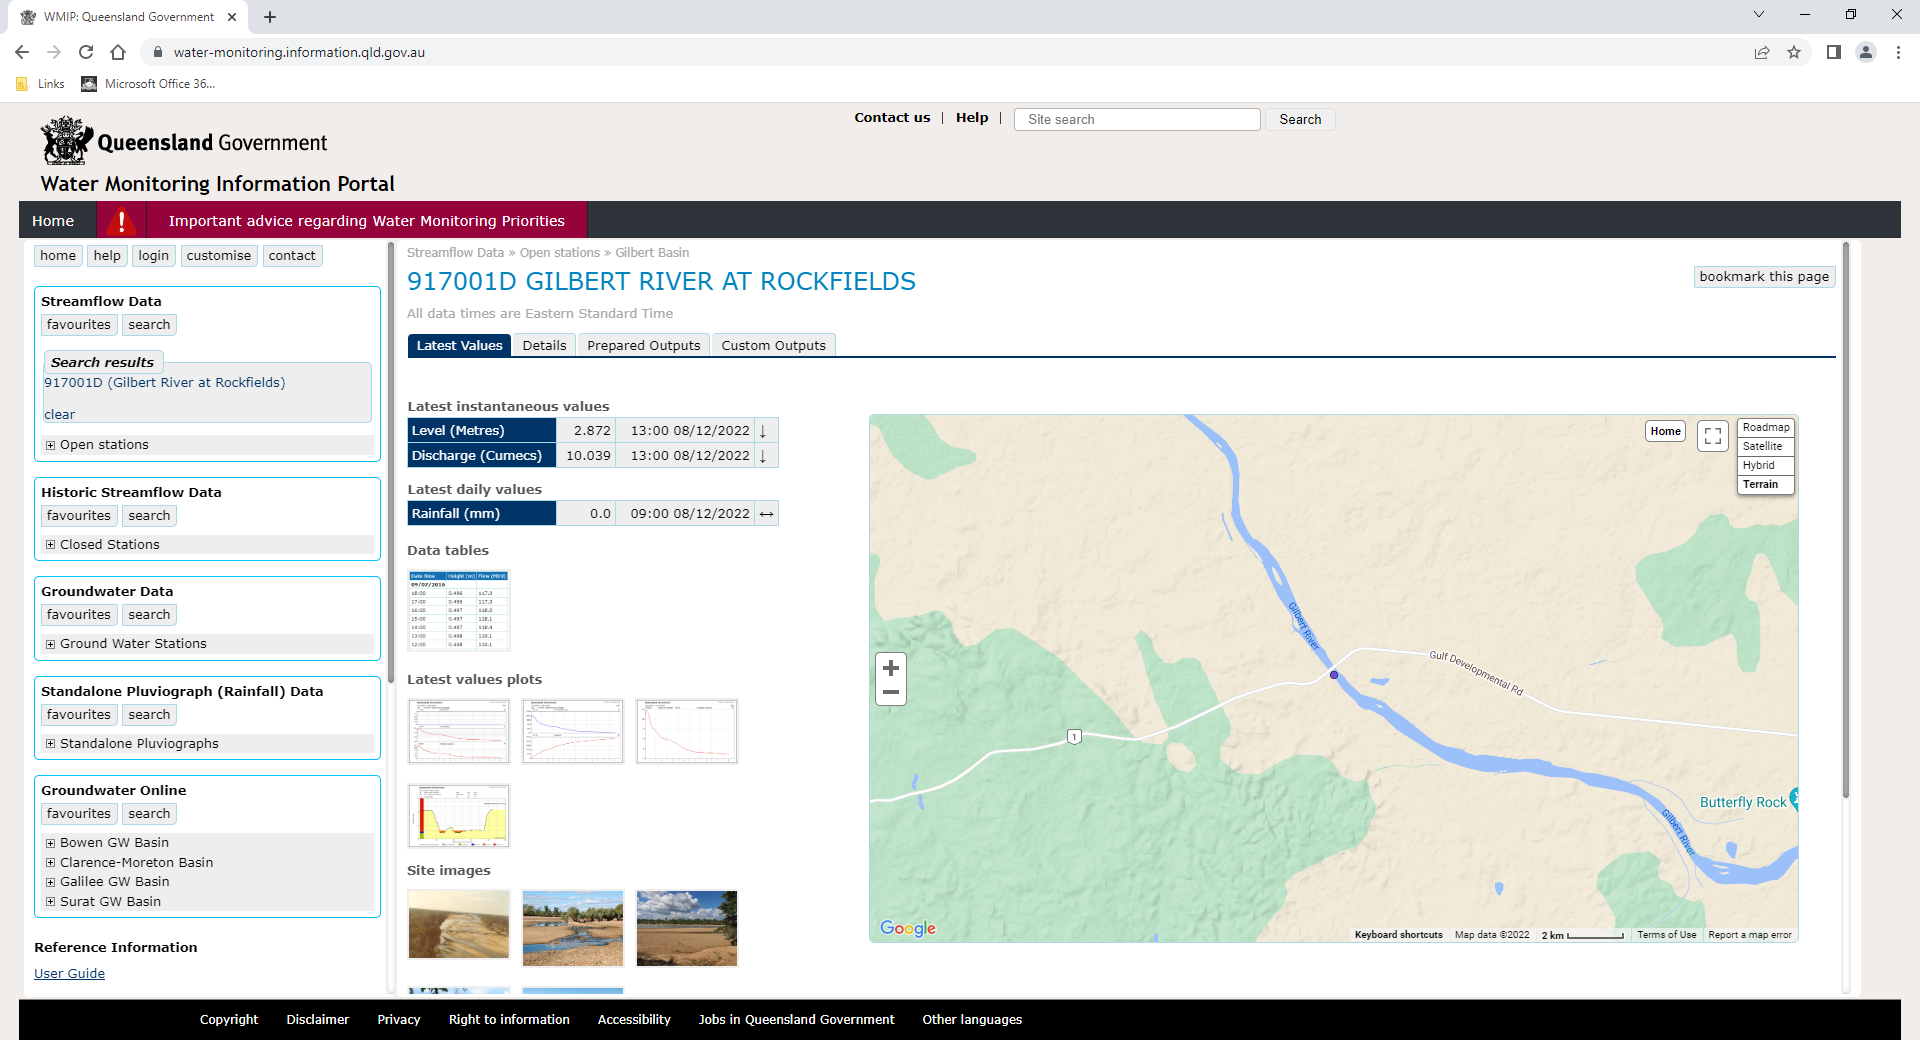
Gilbert River at Rockfields gauge
The Gilbert River at Rockfields gauge would be used by interested parties to apply for the current surface water release in the GRAP.
A river system, especially at a gauged station, is often described by plotting a rating curve. A rating curve graphs discharge (i.e., flow rate of water) vs. stage (i.e., water level). Once a rating curve has been developed for a point along a watercourse it is possible to transform stage measurements to discharge and vice versa. This means that only one of the two measurements (discharge or water level) must be taken.
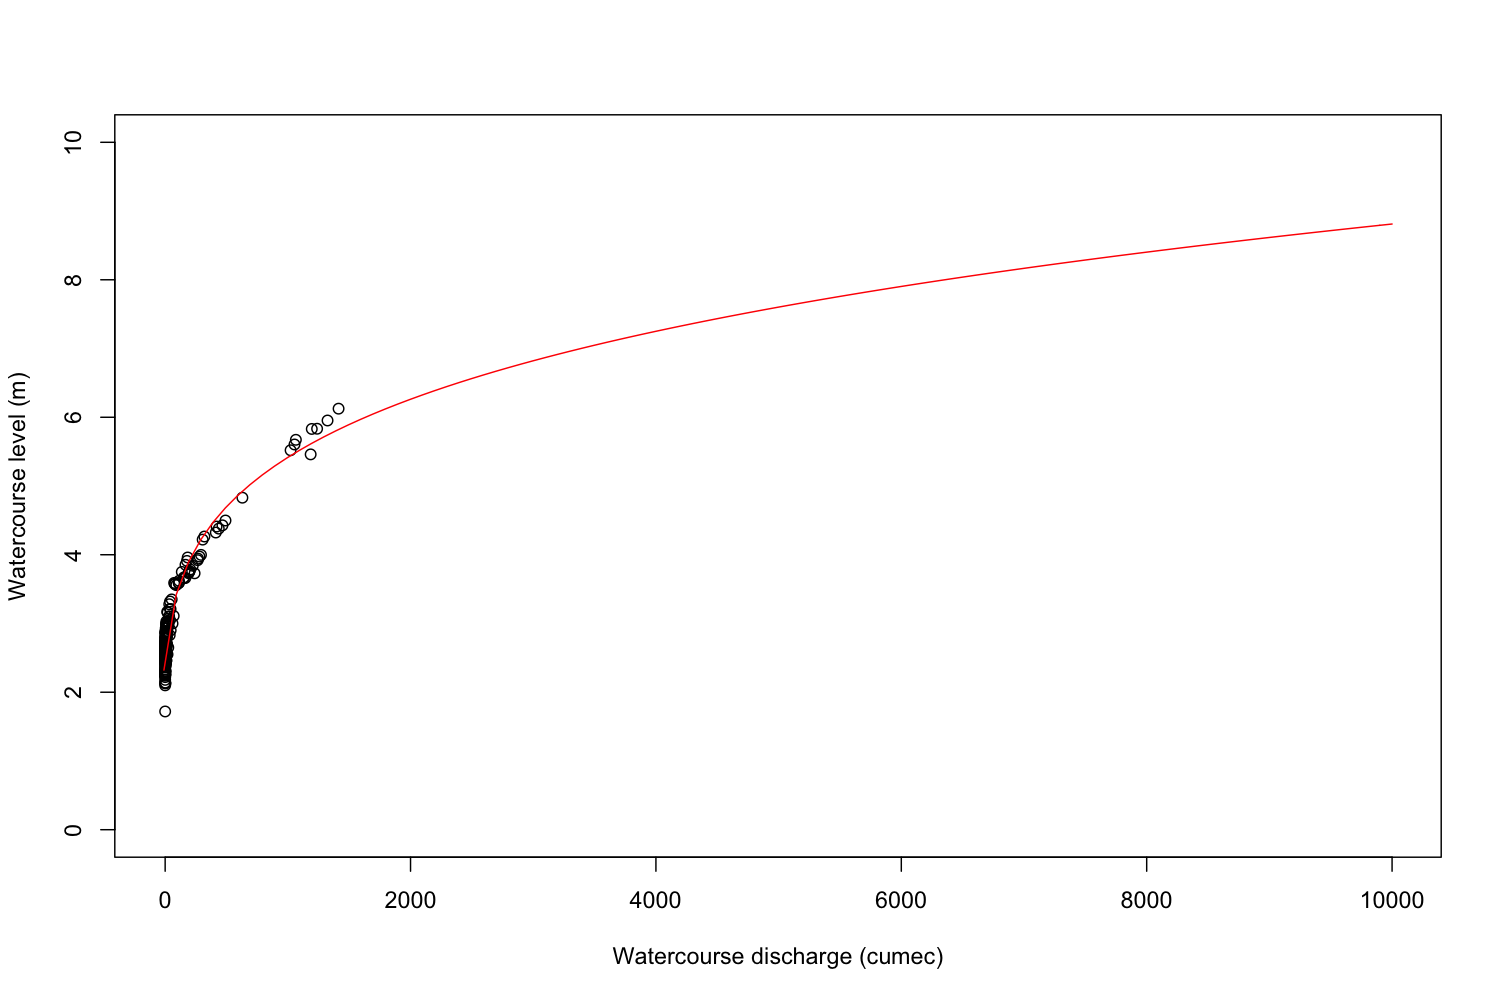
At the Rockfields gauge both stage and discharge are measured and telemetred, meaning that the data collected at the gauge is transmitted to the relevant organisation, here the Queensland Department of Regional Development, Manufacturing and Water.
The Rockfields gauge takes measurements at one side of the Gilbert River. There are some drawbacks of gauging a wide system with a bed sands aquifer using such a gauge. One is the possibility that ‘underflow’ under the gauge in the bed sands is missed. Underflow occurs when water is flowing though the bed sands but along the river surface. Underflow water could be sourced from bed sand water flowing from upstream or connectivity between the bed sands and the underlying aquifer. Flows in the Gilbert River frequently occur on other parts of the surface area of the Gilbert River and therefore could be missed by the gauge.
Water Monitoring Information Portal
On the Queensland Government’s Water Monitoring Information Portal, information that can be accessed are:
- Latest river height and stream flow values from the Department’s water monitoring stations throughout Queensland
- Historic streamflow data from decommissioned river and stream monitoring stations
- Groundwater levels from the Department’s monitoring bores that are equipped with data loggers
- The Department’s water monitoring network site lists This data is reviewed but it is important to note that the latest daily values and instantaneous values are not immediately verified.
In the WMIP, it is highlighted for flood warning purposes that the Australian Government Bureau of Meteorology website should be referred to for the latest information about stream and river heights.
Resources
On this website: