QGIS is a free and open-source software package for GIS analysis. A set of relatively simple R scripts were created to be used in QGIS for analysis of farm dam sites using digital elevation models (DEM).
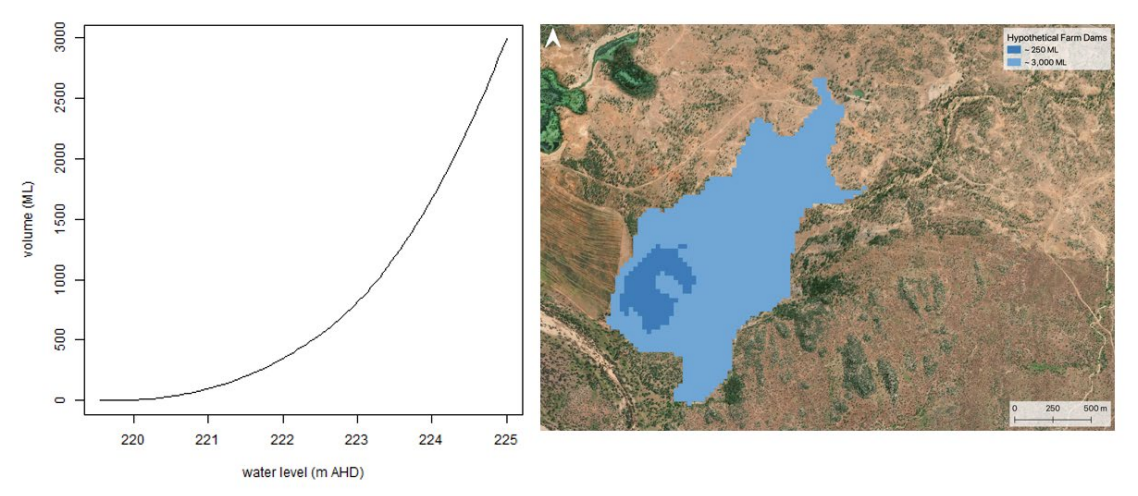
A preliminary assessment of possible sites for dam walls can be made by assessing the area, depth and capacity of the area that would be flooded. The area flooded can be mapped on top of aerial imagery, and an indicative volume calculated for different dam heights. In the example provided here, the smaller dam is ~250 ML, the volume and area of the larger dam will depend on the height of the water level and dam wall. A ~6m high dam wall could hold up to ~3000 ML.
The scripts provide the following functionality:
- Refine dam with DEM: take an initial dam polygon, a DEM layer, and a dam height, and return a polygon defining the area that would be flooded by the dam
- Volume of dam: take a dam polygon, DEM layer and a dam height, and calculate the volume of the dam according to that DEM
- Water level - volume curve: take a dam polygon and DEM layer and calculate volume for a range of heights, visualised as plots
Resources
On this website: